
9.3 KiB
- Project Ideas
- Queen Bee Finder
- Borg Backup Visualiser +- (emacs buffer) jump between versions
- Find/List Fonts By Descriptive Tag
- Find Highlights in Videos
- Generative Doom levels via topic modelling
- ECS-inpsired Uplink-style cybersec game
- BST/AVL visualiser
- ``Can using certain words in CVs, personal statements etc get you a better job?"
Project Ideas
These are some ideas for the MSc summer project. To borrow from Groucho Marx on principles: ``if you don't like them, I have others."
Queen Bee Finder
Rationale: identify if a queen bee is present in an image from a hive
Background: this post on the ffmpeg-user ML where Steven Kan asks if ffmpeg can do `green dot' detection:
Hi,
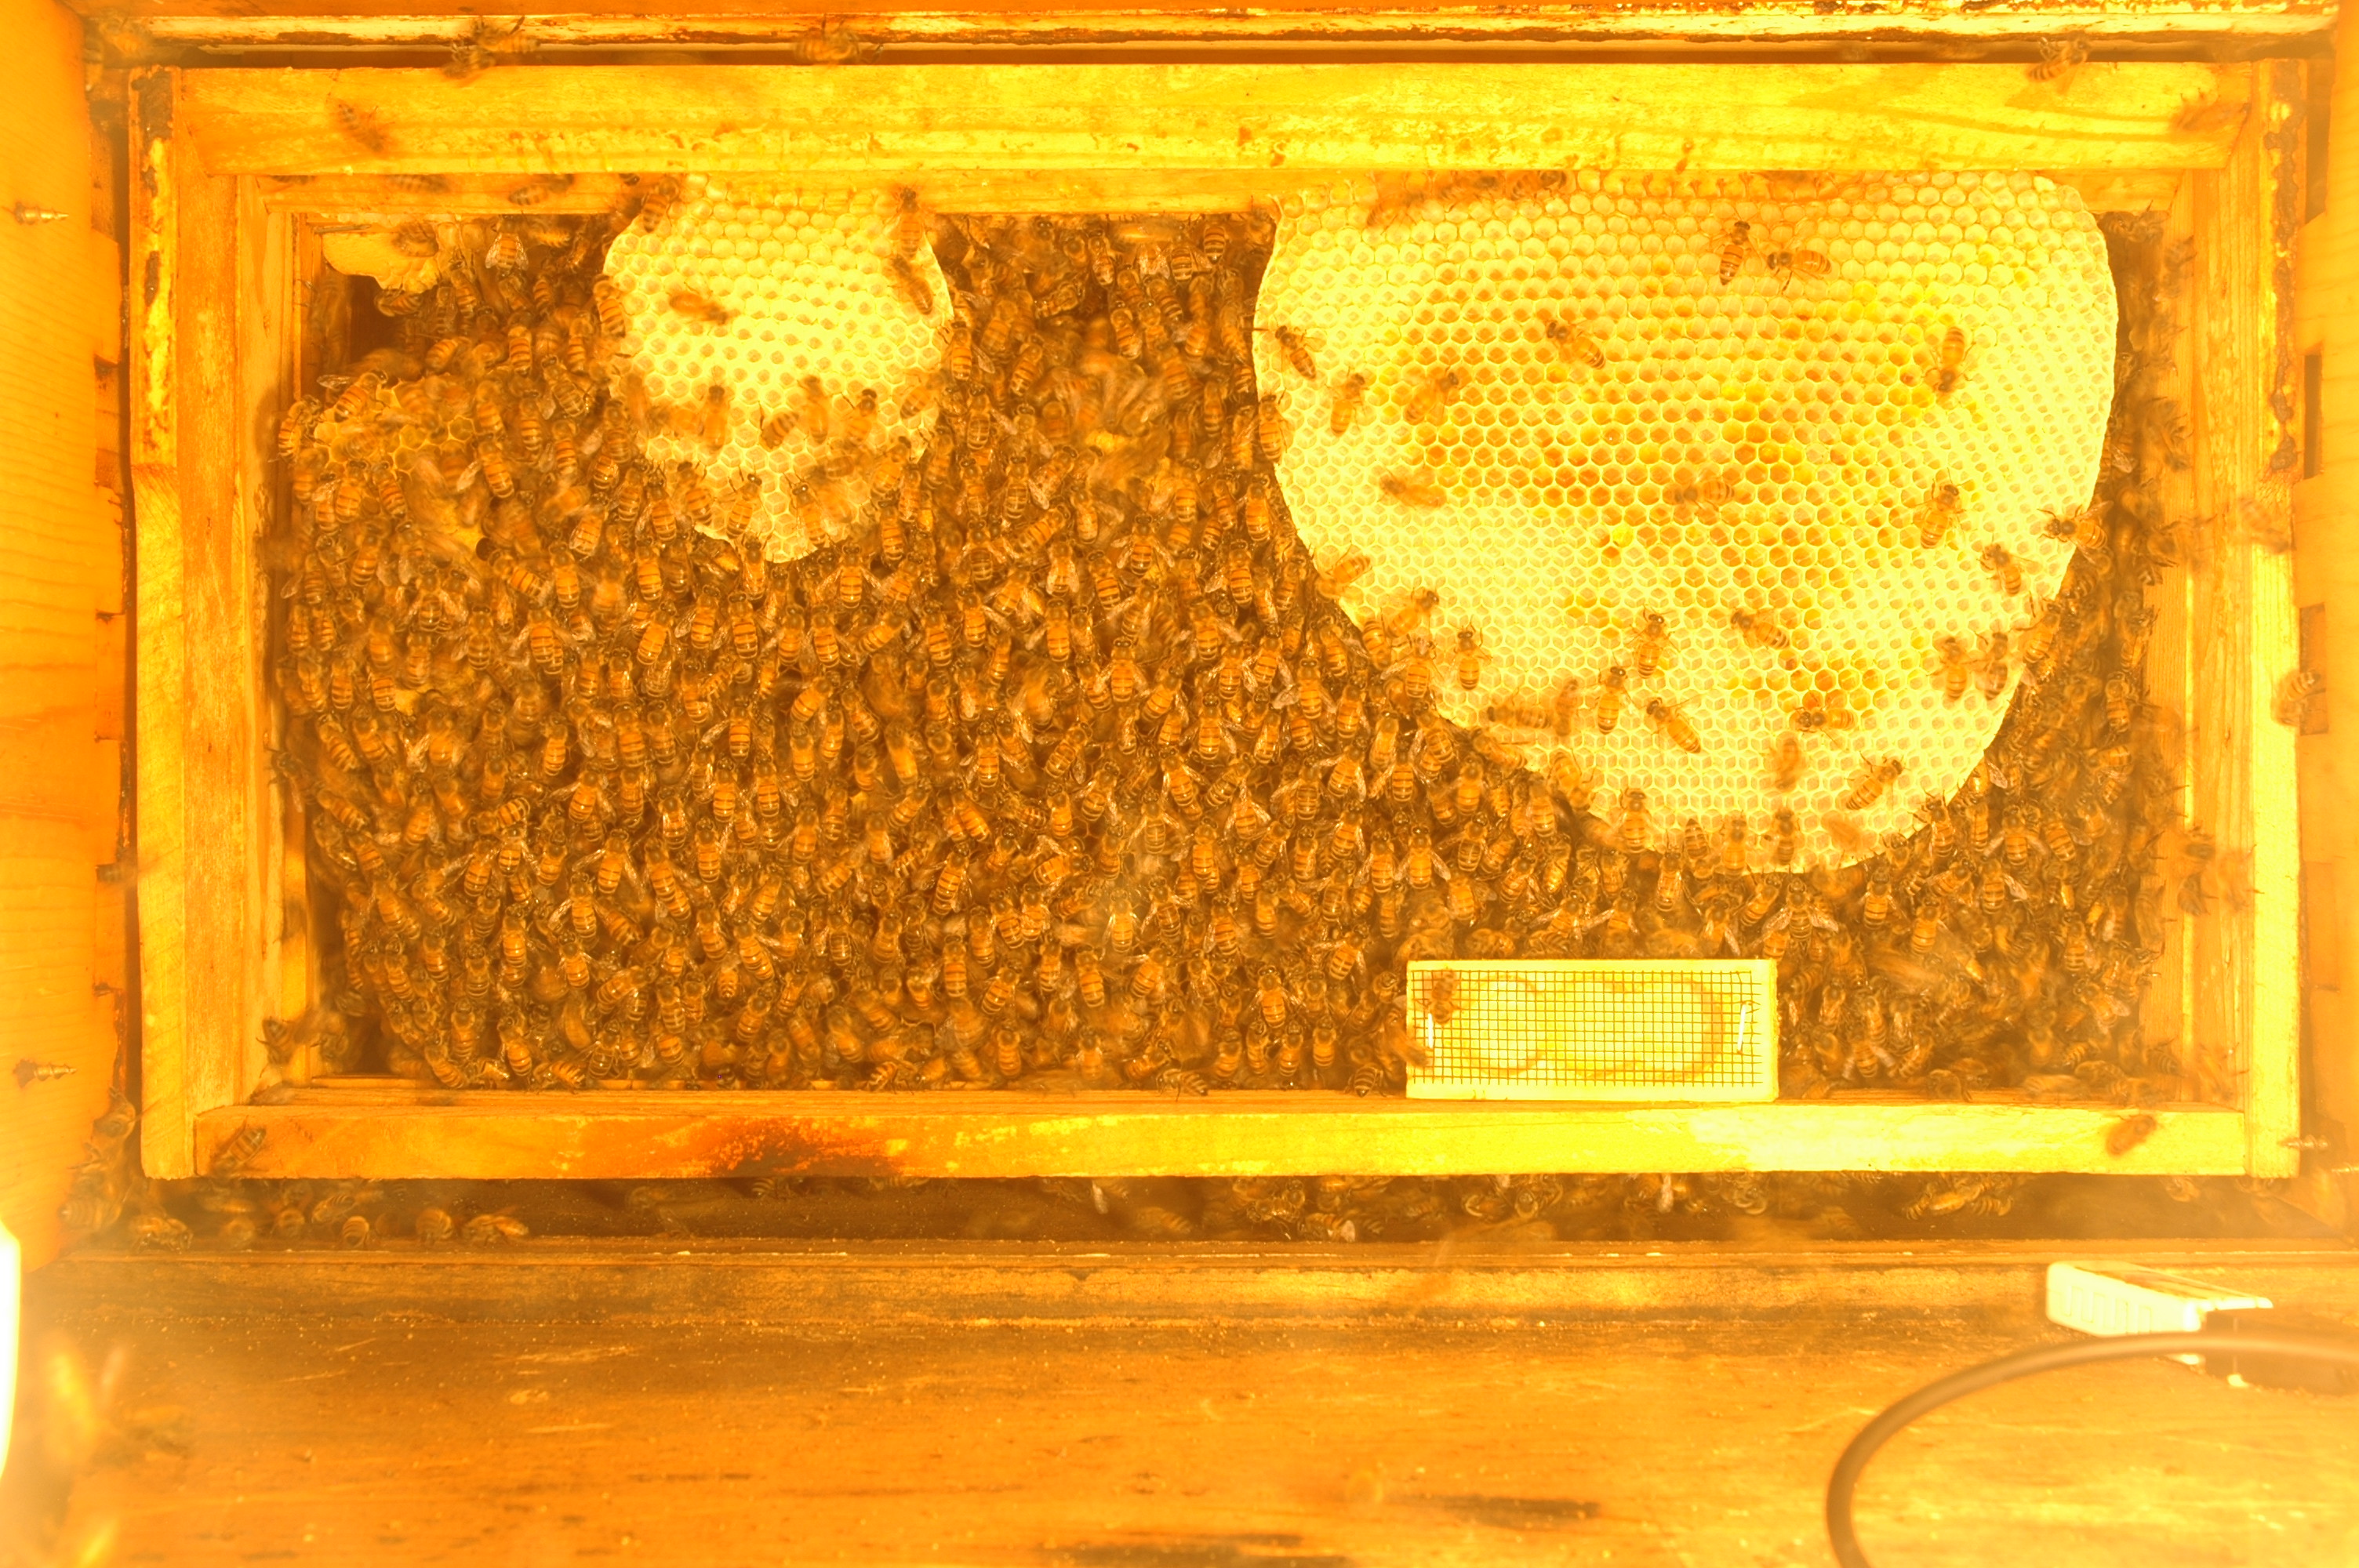
Possibly off-topic, but maybe not. My time-lapse camera rig takes interior photos of my bee hive every 10 minutes. I installed a new queen 10 days ago, and she was released from her tiny cage about 5 days ago. See the little wooden box at the bottom of the photo, here:
https://www.kan.org/pictures/2024-05-21-11-00-11.jpg
Now that she is out and running around, she might be visible in one of the subsequent photos, but she’s very difficult to find, by eye, by scanning though hundreds or thousands of images.
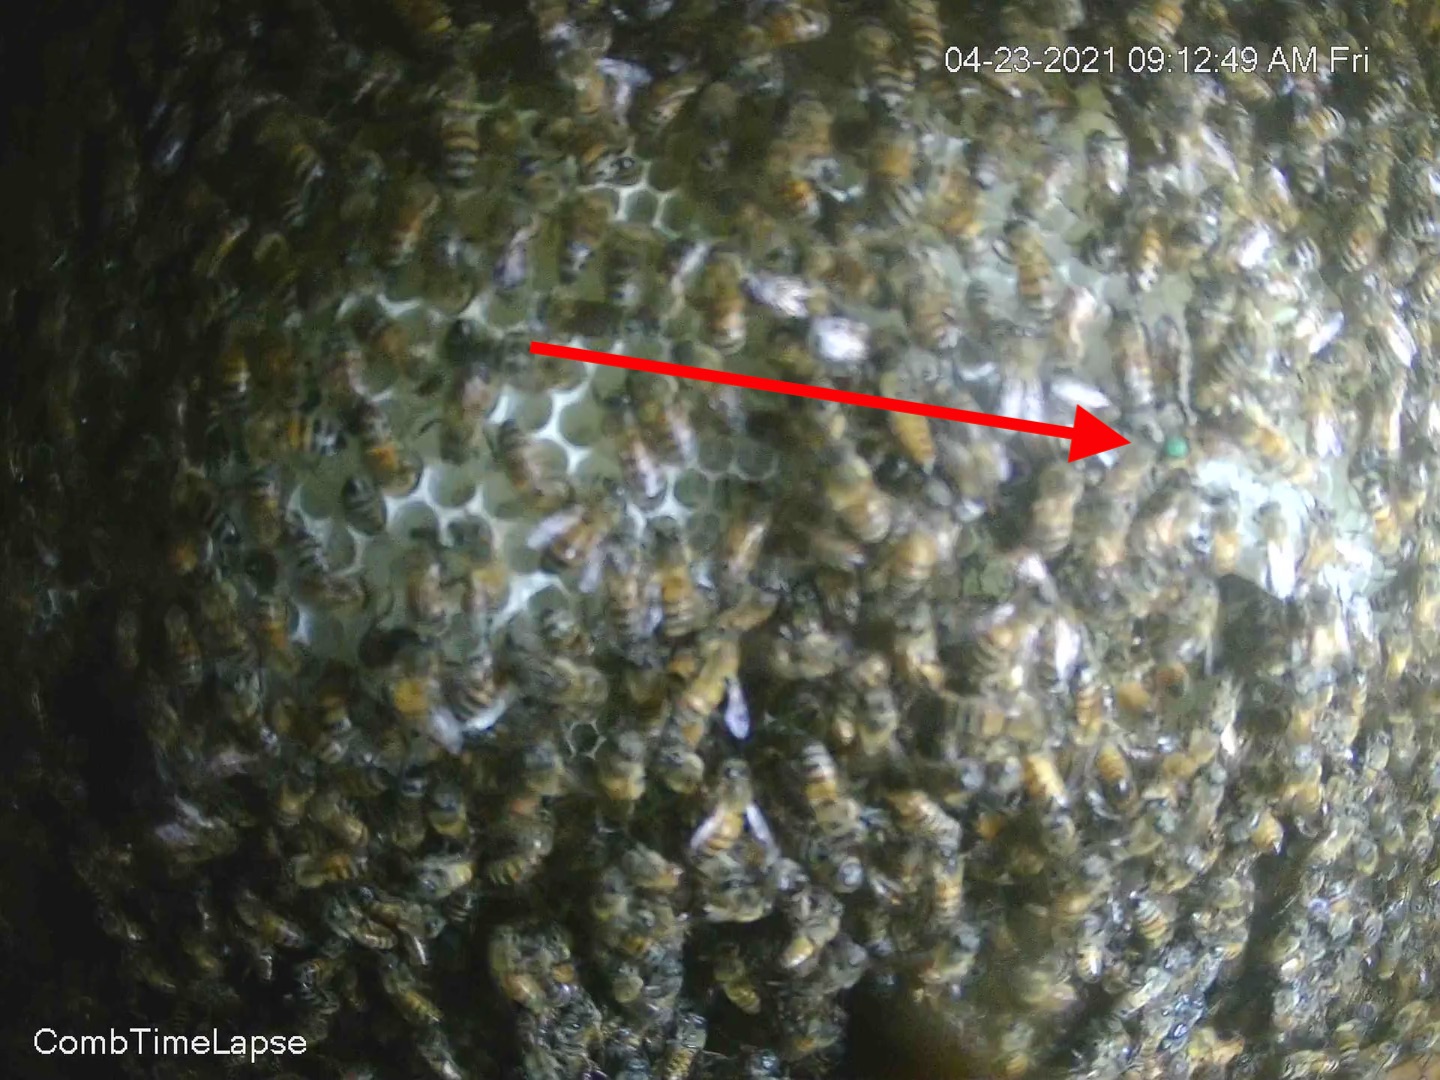
In 2021, with a vastly inferior setup, I did get lucky and find her once:
https://www.kan.org/pictures/CombBuilderTimeLapse2021_Queen1.jpg
Is there any function in ffmpeg that could detect a frame of video that has a region of at least M x N pixels that is at least XX% “green,” for various values of green?
Or am I trying to use a hammer as a Philip’s-head screwdriver?
Thanks!
Approach:
As Kan mentions, ffmpeg is the wrong tool for the job- something like opencv is probably better. The core boils down to: given a list of input images, can we find output the ones with a green dot (the queen bee) ?. This feels like an achievable core goal, and may be too simple for a multi-week project. But there are things that can be added in to make this more interesting:
- can we make it more efficient?
-
eg rather than using expensive CV approaches, can we pre-filter (off the top of my head: playing with colour channels might yield useful results)
- can we make interesting things from it?
-
if we can find the queen, what can we do with that info?
-
OP takes time-lapse photos, by detecting the queen bee we could create short clips of queen `appearances
-
and/or detecting the queen in a still could trigger a `burst' of more frequent photos
-
if OP does social media, an annotated photo with the queen could be automatically posted to followers
-
a heatmap of queen locations could be produced
-
a time/day calendar of appearances could be produced (the last two could well be a proxy for queen health, I'm no apiarist)
-
Challenges: Availability of dataset- OP might or might not be willing to share the photos!
Borg Backup Visualiser +- (emacs buffer) jump between versions
Background: Borg is a FOSS deduplicating archiver used for backups. Because it deduplicates on chunks, it is very space-efficient.
For example, using backups of my home directory (2953 archives):
Repository ID:
Location: ssh://backupserver/home/robert/backups/borg/zeus/home
Encrypted: No
Cache: /home/robert/.cache/borg/
Security dir: /home/robert/.config/borg/security/
------------------------------------------------------------------------------
                       Original size      Compressed size    Deduplicated size
All archives:              160.50 TB            122.78 TB            265.40 GB

                       Unique chunks         Total chunks
Chunk index:                  986207           1414790230
and the usage of a single backup is almost trivial:
Utilization of maximum supported archive size: 0%
------------------------------------------------------------------------------
                       Original size      Compressed size    Deduplicated size
This archive:               58.60 GB             45.01 GB             99.81 MB
Because of this a repository will tend to have a significant number of archives. Getting information on those archives might be useful.
Approach: While it is possible to get a list of archives, this is not quickly interpretable nor terribly pretty.
It would be possible to parse borg output about a repository to construct information on it, eg:
-
earliest / latest backups
-
backups per year/month/week/day/hour (note: will tend to match prune policy)
-
size of individual archives, size over time, № files in each archive, № files over time…
These could be output (nicely-formatted) by a cli tool, visualised in a Grafana dashboard – the latter potentially handy for aggregated info from multiple repos (for example, I do both file-level backup and block device backups).
Document Versions
Another thing that would have uses is quickly jumping between document versions. For example, an org file might be edited over time, headings added, removed and moved around.
A tool could traverse a repository, extracting all unique versions of a given file. A tool like Emacs might provde a nice convenient wrapper around navigating/viewing these (in whole, as diffs); a similar function for files under version control is possible using its VC functionality (for eg git, SVN), and magit also offers some nice functionality for git here.
Find/List Fonts By Descriptive Tag
Context: finding a particular type of font beyond serif/sans-serif is tricky, it would be helpful to be able to search for eg `handwritten', `
Find Highlights in Videos
Context: I play video games with friends, which I stream to twitch and record. It would be nice to have the highlights from these videos, but given that I may not remember to keep a note of that and that a video might be a couple of hours long, is there a way we can `scan' a video file and produce timestamps that could be checked for highlights.
Approaches: [mostly based on audio track] simple- use audio level (ie louder parts are parts are more likely to be `interesting'); less simple: probabilistic detection of laughter (funny bits are likely to make good highlights; non-trivial, possible use for ML approaches?); the type of talking and background of game audio might be too noisy for speech recognition, but some limited word recognition might be possible, and it might be easier to do speaker identification (the thinking being that a point where multiple speakers talk in close temporal proximity is likely to be interesting and a candidate for a highlight)
Alternative: I also used to record footage of a weekly Sunday morning football game (non-competitive), it would be good to find highlights (goals, penalties, saves/near-misses) in those. I have much less footage of that, however.
Generative Doom levels via topic modelling
Topic modelling is a statistical approach originally used to discover `topics' in texts but now expanded to subjects like bioinformatics (eg gene expression, metabolomics, etc; see LDA). In my head they are conceptually very very very fancy and complicated Markov models.
Classic Doom is regarded as `the mother of all FPS games' (though it wasn't the first, most FPS games that followed it were referred to as `Doom clones'). Its levels are 2.5D masquerading as 3D, but tend to have recognisable structures- rooms, doors, items, a start point and a finish. I wondered if a topic modelling approach might yield interesting results if used to procedurally generate Doom levels.
Note: there is a very well-regarded mod called Doom Infinite which already takes Doom into the genre of roguelikes, so I have probably already been scooped here!
ECS-inpsired Uplink-style cybersec game
During the Enterprise Cybersecurity course, I had the notion that there might be an interesting game concept in the Uplink style. A player could take the role of a white hat defending assets, or a black hat trying to engage in asset extraction. This would use concepts mentioned in the ECS course and potentially evolve over time to represent the changing nature of cybersecurity over decades (analogous to a `tech tree' in other games). Needs a lot of work to develop into an idea that is both concrete and actually fun to play.
BST/AVL visualiser
I thought of this as an exercise and animated teaching aid, but on their own they are likely too trivial; however they could be extended to other CS concepts (searches, sorts, pathfinding).
``Can using certain words in CVs, personal statements etc get you a better job?"
This was a passing thought as a piece of pop data analysis: scrape published CVs, public personal career statements etc correlate to known positions eg via Linkedin (correlate those positions to salary estimates); throw as many fancy regression/clustering approaches at them that will stick, see if anything falls out. If, as Andrew Lang said, ``Most people use statistics like a drunk man uses a lamppost; more for support than illumination'', this is using it to hunt for loose change on the ground.
Note: extremely questionable methodologically to the point of potentially being Buzzfeed-level filler rather than ACM; but such things can sometimes uncover unexpected outcomes…